Meeting-ready in one click
Pick a template or describe what you need — OPTEAM drafts the narrative, charts and tables from live data.
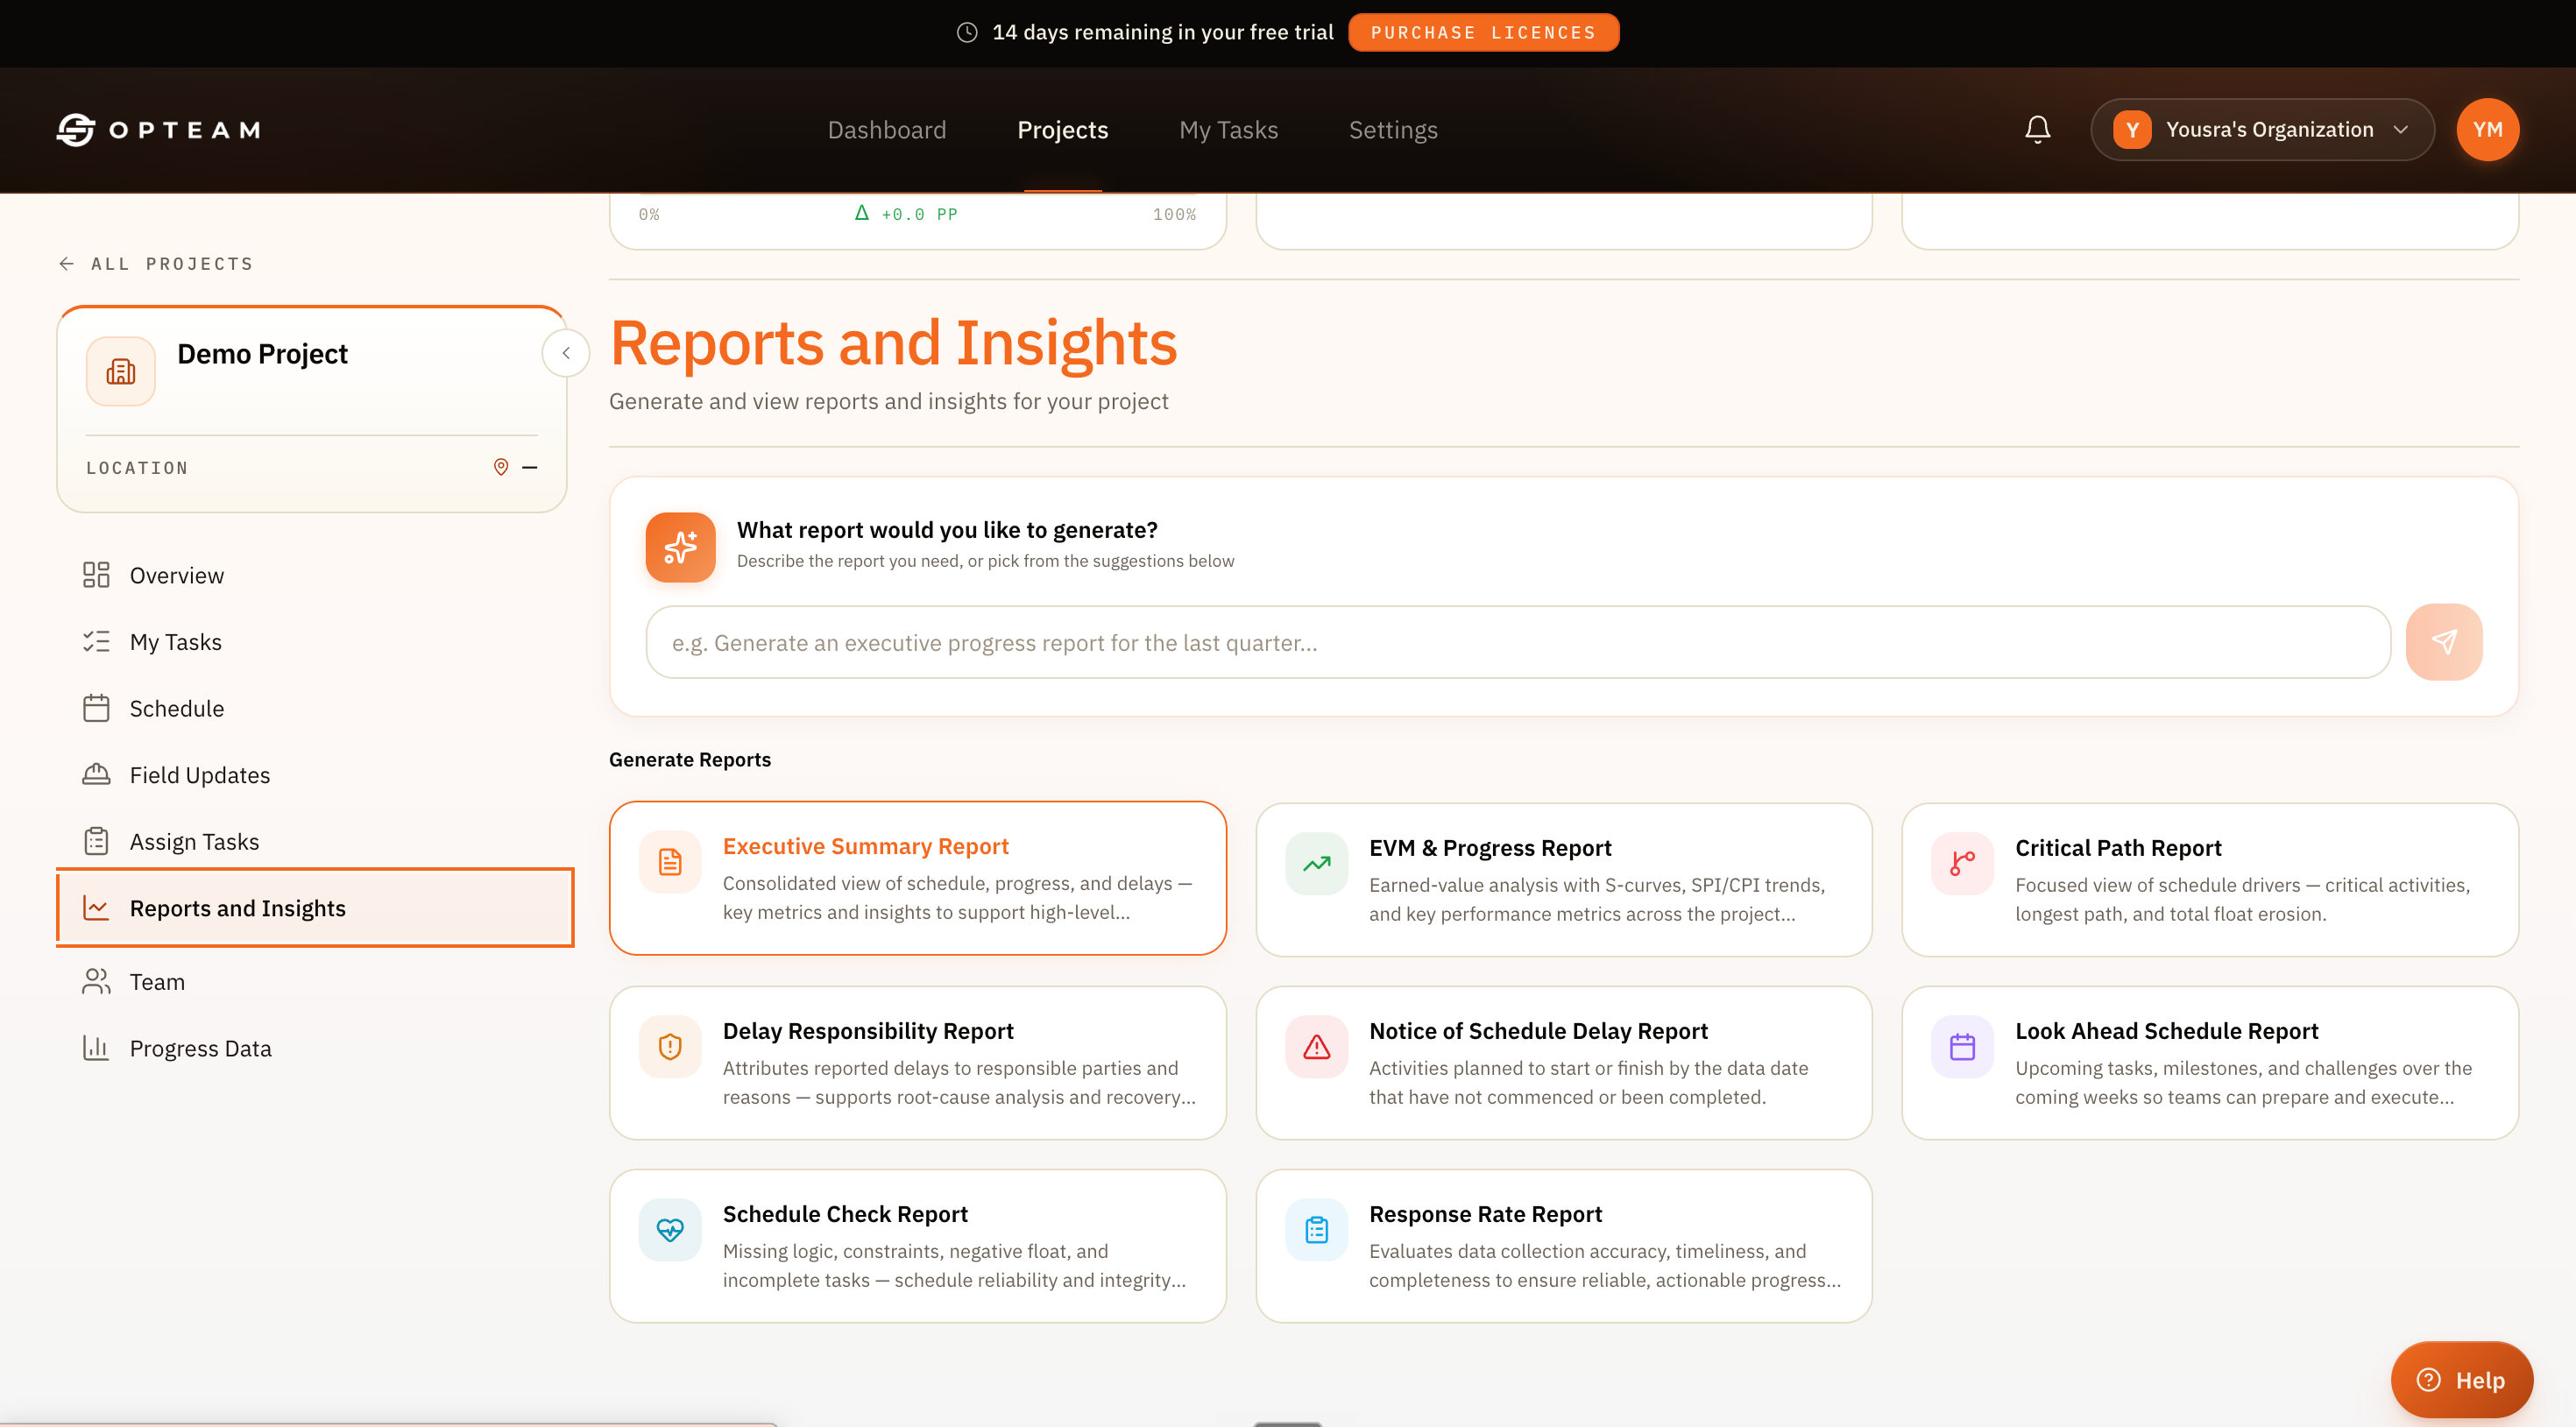
Executive summaries, earned-value analysis, delay-responsibility, look-ahead and more. Generated from site updates by AI and sent to you automatically.
Executive summary, EVM & progress, critical path, delay responsibility, look-ahead, schedule check and more. Built from your live site data.
Pick a template or describe what you need — OPTEAM drafts the narrative, charts and tables from live data.
SPI/CPI, S-curves and variance computed from your schedule, not stitched together in spreadsheets.
Every figure traces back to the activity and update behind it, ready for owners and claims.
OPTEAM turns the numbers into a report any stakeholder can read, with variance, recovery options and the story behind them.
Choose a report type or describe the report you need in plain language.
OPTEAM pulls live data and drafts the narrative, charts and tables.
Export to PDF or automatically send every reporting cycle.